Mutual Fund Dashboard Report
![]()
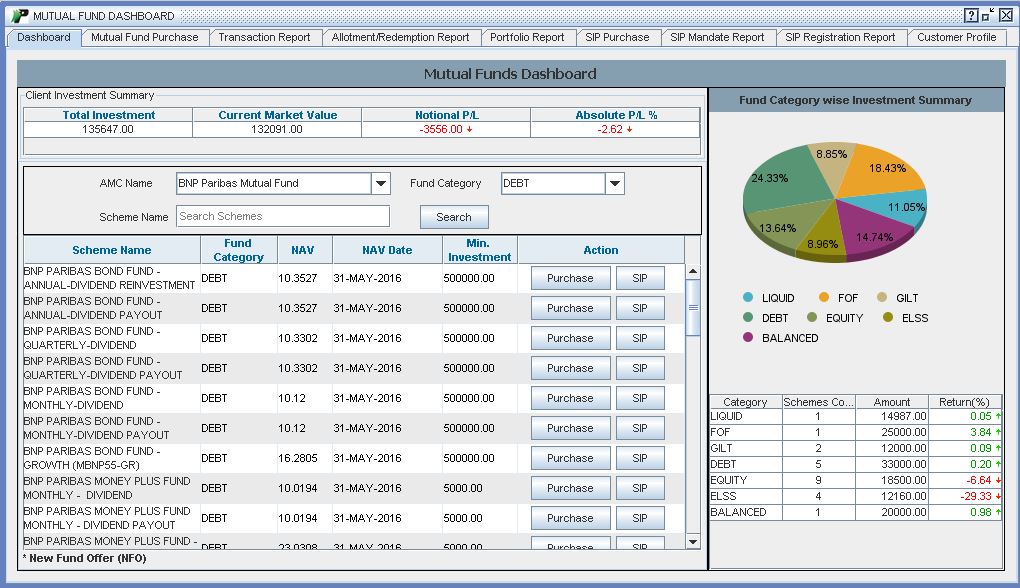 |
Mutual Fund Dashboard will reflect Client's Portfolio in various Fund Categories. Client can also search the schemes and directly purchase from here. In this we have three Panels i.e. Client Investment Summary, Mutual Funds Search and Fund Category Wise Investment Summary.
Client Investment Summary
In Client Investment Summary, it will show the summary of Total Investments made by client, Current Market Value, Notional Profit/Loss and Absolute Profit/Loss%. Following are the fields in Client Investment Summary.
- Total Investment - Total Investment refers to a total net investment made by client across all AMCs.
- Current Market Value - In Current Market Value,current value of the investment which is made in the Past are there and it is derived from the Total units Purchased multiplied by Current NAV.
- Notional P/L - The notional Profit/Loss refers to the total profit or loss occurred from total Net Investment made by the client.
- Absolute P/L - It is same as a Notional P/L but it will show profit in percentage form.
Mutual Funds Search
Mutual Fund Schemes can be searched by applying filters on Fund House, Fund Category and Scheme Name.
- Scheme Name - It display the list of schemes available for investment.
- Fund Category - It displays the name of the category in which scheme belongs to.
- Net asset value (NAV) -It displays the latest NAV Available.
- NAV Date -In this field NAV Date at which last NAV available.
- Minimum Purchase Amount -It is the minimum amount that can be invested in the scheme.
- Action - Click Purchase Button to invest in the scheme.
Fund category wise investment summary
In Fund category wise investment summary, it will show the summary of Total Investments made by client in different fund category. Following are the fields in Fund category wise investment summary.
- Category - It displays the fund category name in which client has made investment.
- Scheme Count - It displays the total number of schemes in particular category, in which client has made investment.
- Amount -Amount invested in particular category.
- Return(%) -Absolute Return Percentage in the category.
- Chart -The Pie chart represents the total investment made in different categories.